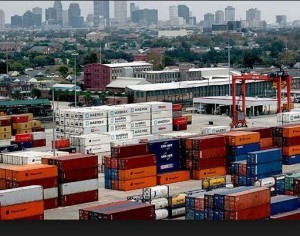
China Dominates Indonesias Non Oil and Gas Market
 Statistics Indonesia (BPS) informed that export value of Indonesia in November 2016 reached US$13.50 billion or increased by 5.91 percent compared to export in October 2016, or increases by 21.34 percent compared to November 2015.
In the meantime, the value of import in November 2016 reached US$12.66 billion or increased by 10.00 percent compared to October 2016, and increased by 9.88 percent compared to November 2015.
The press release of BPS showed that non oil and gas exports in November 2016 reached US$12.39 billion or increased by 6.04 percent compared to October 2016, and 28.75 percent compared to November 2015.
Cumulatively, Indonesias export value from January to November 2016 reached US$130.65 billion or decreased by 5.63 percent compared to the same period in 2015. Likewise, non oil and gas exports reached US$118.80 billion or decreased by 1.96 percent, BPS said.
According to BPS press release, animal/vegetable fats and oilsrecorded the biggest increase of non oil and gas export in November 2016, compared to October 2016, which export value reached US$366.1 million (20.37 percent). Meanwhile, iron and steel recorded the biggest decrease US$67.8 million (30.57 percent).
Regarding destination countries or non oil and gas exports in November 2016, according to BPS, China recorded the biggest value i.e. US$1.81 billion, followed by the United States US$1.33 billion, and Japan US$1.30 billion. Contribution of these countries reaches 35.84 percent. Meanwhile, export value to European Union (28 countries) is 1.34 billion, BPS wrote.
BPS data also showed that non oil and gas exports of process industries in November 2016 decreased by 0.28 percent compared to the same period in 2015, and export of mining products and others decreased by 9.75 percent, whereas export of agriculture products decreased by 10.48 percent.
Regarding the origin of the export goods, from January to November 2016, West Java recorded the biggest value i.e. US$23.43 billion (17.93 percent), followed by East Java US$16.91 billion (12.94 percent), and East Kalimantan US$12.57 billion (9.62 percent).
Import
In regards to import, BPS stated that non oil ad gas imports in November 2016 reached US$10.90 billion or increased by 9.39 percent compared to October 2016. Likewise, compared to November 2015, it increased by 10.31 percent.
Oil and gas import in November 2016 reached US$1.76 billion or increased by 13.89 percent compared to October 2017, and increased by 7.27 percent compared to November 2015, BPS said.
Cumulatively, according to BPS, import value from January to November 2016 reached US$122.86 billion or decreased by 5.94 percent compared to the same period in 2016. Cumulative import value is comprising of oil and gas import US$17.07 billion (decreased by 25.17 percent) as well as non oil and gas US$ 105.79 billion (decreased by 1.87 percent).
According to BPS, in November 2016, machines and electrical equipment recorded the biggest non oil and gas imports that is US$210.3 billion (15.23 percent), while ships and floating buildings recorded the lowest value of US$ 55.8 billion (40.97 percent).
Three biggest origin countries of non oil and gas import goods from January to November 2016 are China, which value is US$27.55 billlion (26.04 percent), Japan US$11.84 billion (11.20 percent), and Thailand US$7.95 billion (7.52 percent). Non oil and gas imports from ASEAN reached 21.57 percent, while from European Union 9.18 percent, BPS wrote.
Import value of raw materials and capital goods from January to November 2016, according to BPS, experienced a decrease compared to the same period last year i.e. 6.77 and 10.57 percent respectively. On the other hand, import value of consumption goods increased by 13.07 percent. (Humas BPS/ES)(MMB/YM/Naster)


